
The number trap: why it might not pay to delay
4-MINUTE READ
When prices are low and the outlook offers little encouragement, the hardest decision can be accepting what the market is telling you now – rather than waiting for a number to which it may not return.
What do the following have in common?
Jerry wants to sell his car. He insists on getting £8,000 for it because that’s what he paid for it last year.
Sally is keen to buy the house next door to her friend, but won’t offer more than £300,000 because that’s what her friend paid for her house three years ago.
Mike keeps putting his money on 14 at the roulette wheel. The number won big for him once, so surely it must come up again.
In each case, the decision isn’t really being driven by today’s reality. It’s being driven by a number from the past.
In grain marketing, the same thing can happen. Some farmers only sell if the market reaches a certain price – perhaps last year’s high, perhaps a figure that “feels right” – and they hold on, even as the market moves further and further away.
The uncomfortable truth is: the market doesn’t know or care what number you’re waiting for.
The danger of the “number trap”
This is what we might call the number trap: a mental anchoring to a historic price, even though market conditions have changed.
Time on the market increases, while value quietly erodes. Grain is being held for a price the market has already moved past.
In this situation, the past price becomes emotionally important, not economically relevant. Instead of responding to current signals, we might wait for a target that no longer reflects reality.
It’s easy to blur the difference between cost and value. What it costs to grow a tonne of grain matters hugely to your business planning – but sadly, it has no bearing on what someone is prepared to pay for it today.
Anyone who has played blackjack knows the feeling when you’re dealt a 10 and a 6. Statistically not a great hand. The temptation is strong to twist for a shot at 21 even though the chance of going bust is high.
So is it currently time to stick or twist?
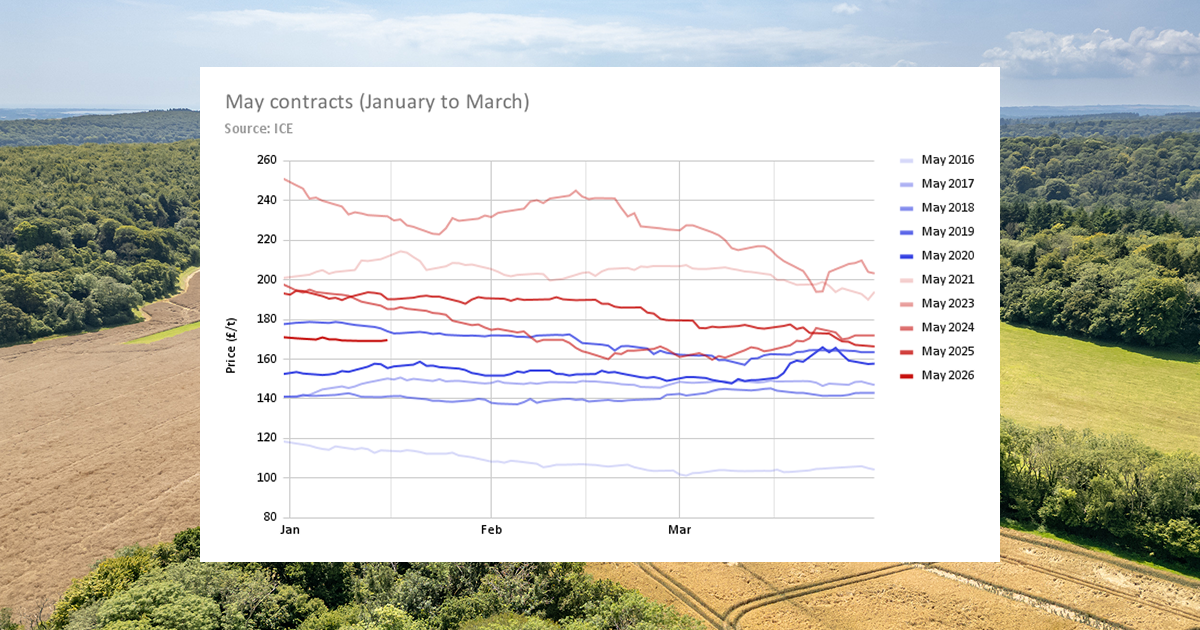
In the past 10 years, the UK feed wheat May contract has often drifted downwards between January and March
What the futures market shows us
Let’s look at the benchmark May “old crop” contract for UK feed wheat.
The May 2026 contract ended last year just above £171/t. So far in January it has been trading between £169/t and £170/t, with no sign of upward momentum.
Does recent history give us any reason to expect a spring lift?
We can compare the past 10 years – looking at how each year’s May contract performed between the start of the year and the end of March – to see if a pattern emerges.
We’ve omitted 2022’s sharp price rise following Russia’s invasion of Ukraine from the line chart above, to help compare patterns in the other nine years. We can consider 2022 unrepresentative, as a major geopolitical event had a sudden and direct impact on global grain supply.
More often than not, the first three months of the year show a slow drift downwards. In six out of the past 10 years, prices fell between January and the end of March. In five of those years, including the last three, the drop was more than £10/t.
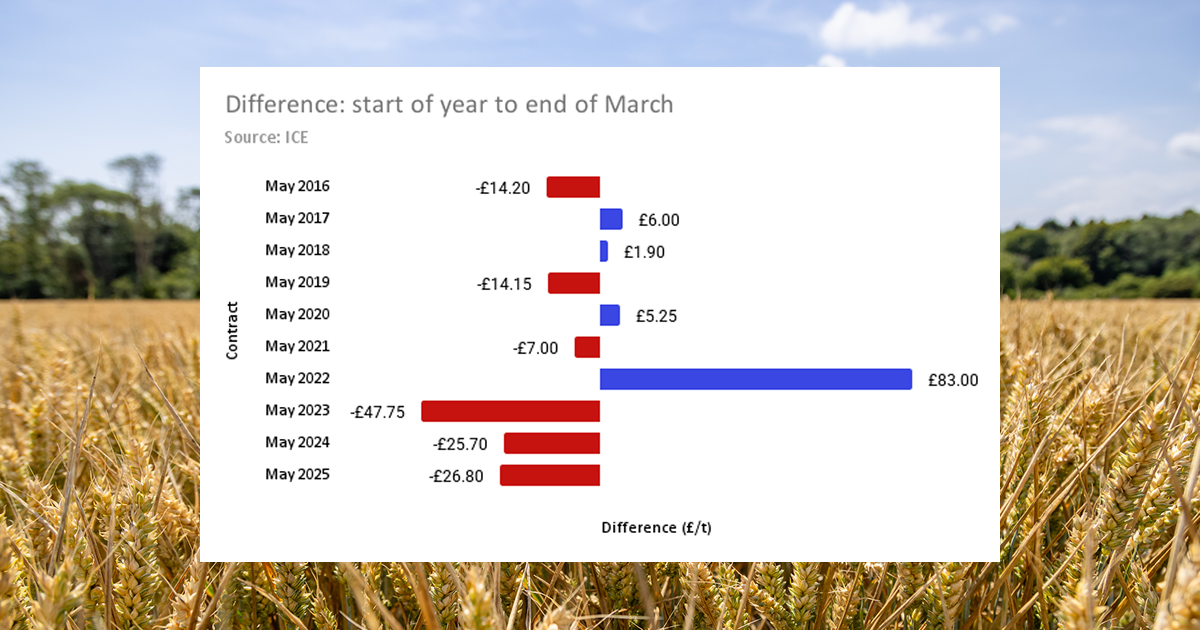
In six of the past 10 years, the UK feed wheat May contract has fallen between the start of the year and the end of March
What about holding on until the very end of the contract, on the assumption that prices might rise as supplies of old crop tighten ahead of harvest?
Again, the data offers little encouragement. Over the past decade, aside from the 2022 outlier, we can see a general pattern of sideways movement from April to May.
We might expect to see some sudden price shifts in the last few days of the contract as settlement comes into view, but instead the chart shows a more gentle finish is typical for the benchmark May contract.
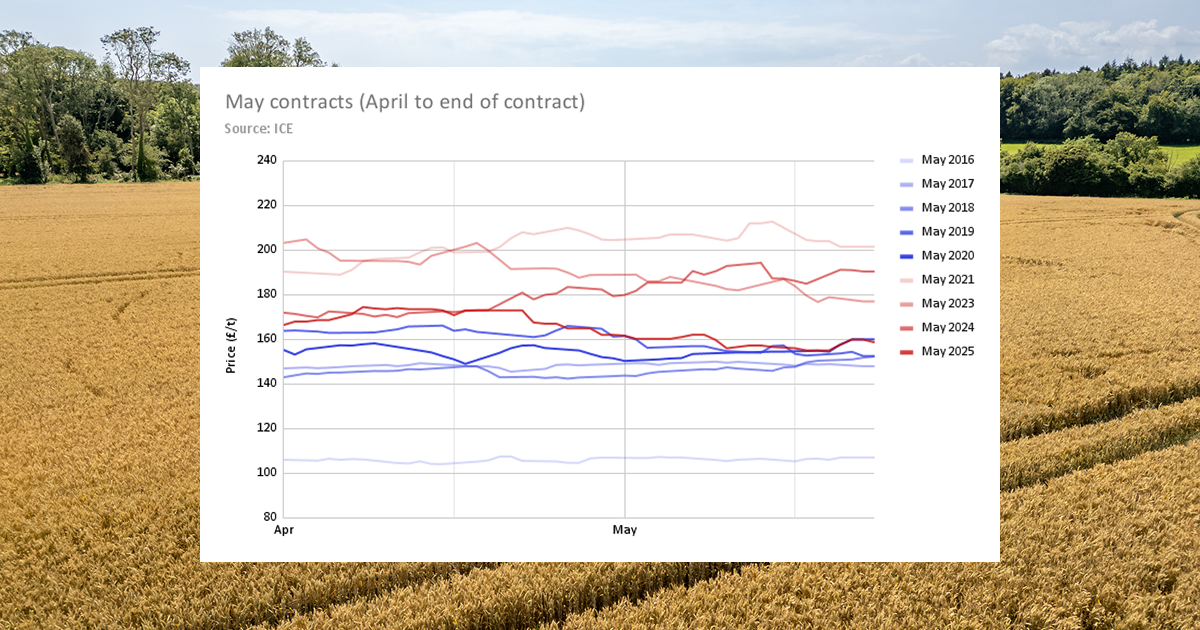
Omitting 2022 as an outlier, the UK feed wheat May contract has typically moved sideways between April and the contract end
Looking at the whole period – from the start of the year to the end of the May contract – the picture appears quite balanced at first glance, with five increases and five drops. Might it be worth holding on for a 50/50 chance of higher prices?
Drill a bit deeper, however, and the asymmetry becomes clear. Apart from the exceptional £112/t rise in 2022, only one of those increases was greater than £10/t.
By contrast, four of the five declines were more than £10/t, three exceeded £25/t, and one saw a dramatic £74/t drop in 2023 as the market corrected after the 2022 rally.
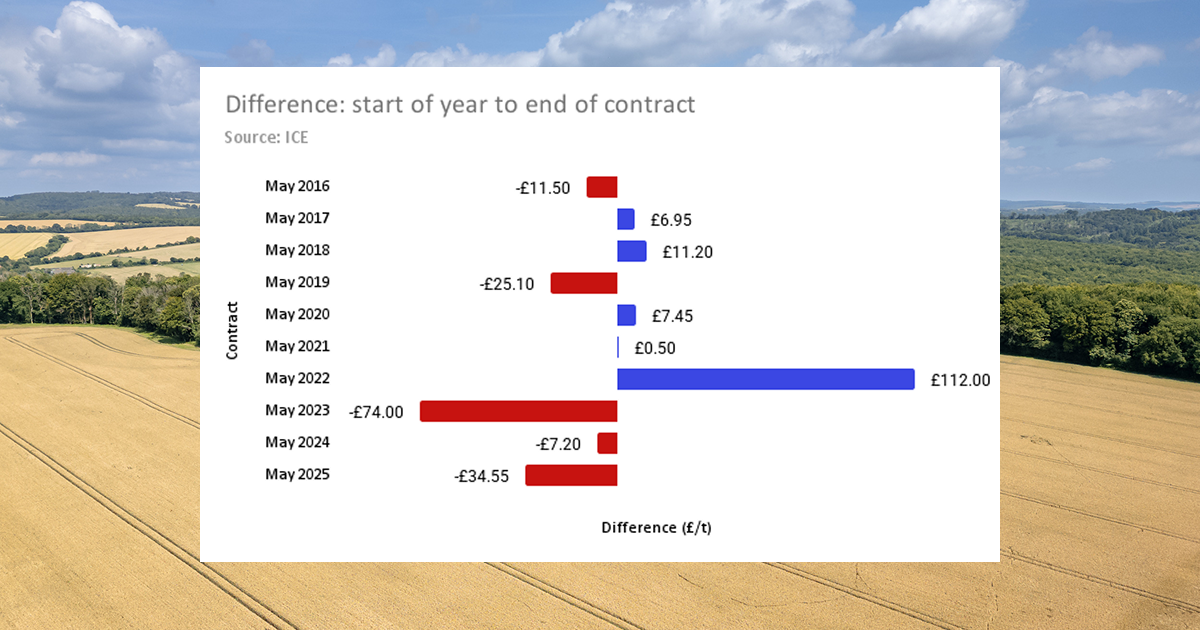
In four of the past 10 years, the UK feed wheat May contract has fallen by more than £10/t between the start of the year and the contract end
Why prices are staying under pressure
There are strong fundamental reasons why grain prices remain subdued as we move through early 2026.
The latest US WASDE report confirms a global abundance of supply across many crops, with production outstripping demand. There have been record harvests in the Southern Hemisphere, especially in Argentina, and the Argentine government is keen to boost grain exports by reducing tariffs.
Meanwhile, geopolitical uncertainty – popular revolt in Iran, US plans to own Greenland, ongoing trade disputes – has so far failed to make a dent. The war in Ukraine shows no sign of ending, but its impact on grain production is already well understood and priced in. It’s difficult to see what new factor would suddenly shift sentiment.
None of this guarantees prices won’t rise. But it does suggest there are no clear signals pointing to a spring recovery.
Benchmarks versus anchors
In light of this, it’s important to have clear price targets. A good grain marketing strategy should be built around explicit benchmarks, informed by your costs, cash-flow needs and appetite for risk.
The danger comes when a benchmark turns into an anchor.
A benchmark helps you decide how and when to act. An anchor is a fixation on a number that prevents action altogether.
In an auction house, a seller sets a reserve price below which they won’t sell. But what happens if bidding dries up and interest disappears? Should the seller stay fixed on their reserve price?
The lack of bids is the market giving feedback. Ignoring that feedback simply delays the decision.
A pragmatic approach
Selling grain at a loss is never comfortable. But neither is watching storage costs accumulate, quality risk increase and opportunities quietly slip away while waiting for a price that may not return.
For many farms, the more pragmatic approach in a flat market may be to sell some tonnage now, even if the price feels disappointing, as a way to actively secure cash flow and reduce exposure to further price drops.
Sometimes the value isn’t in the price – it’s in what the sale unlocks, in terms of being able to plan budgets with certainty and the mental relief from watching the market every day.
No choice feels perfect in this market, and the hardest part is often letting go of the number in your head. But once you do, decisions can become clearer and calmer. Sometimes, the best move in a difficult market is simply to accept the hand you’ve been dealt, and play it well.
Visit Hectare Trading to access our live view of the grain market and recent trades in your region. It’s free to post a listing and farmers earn £5.54/t more* on average for feed wheat.
This article is for general information only and is not an instruction to trade. While we make every effort to ensure the accuracy of the content at the time of publication, Hectare Trading makes no guarantee regarding the data provided. *Hectare Trading data: 30/11/23–12/11/25.