
Harvest 2026: what really happened?
4-MINUTE READ
Now that combines are back in the shed, what’s the full story of harvest 2026? We’ve been digging into the data to find out what this year’s harvest could mean for grain prices, farm margins and your own marketing decisions.
After nine weeks of spring drought followed by intense summer heatwaves, harvest started exceptionally early across East Anglia, Kent and Sussex. Fields were tinder-dry, crops raced to maturity and the first reports from the South and East quickly suggested that yields were going to disappoint.
As the summer progressed, a few bright spots emerged. Oilseed rape had a remarkably good year. Milling wheat quality held up surprisingly well. Further north, some spring barley crops performed much better than those in the South.
And yet, the prevailing mood was frustration.
The weather set the scene
This was a year of extremes: record temperatures, fast starts and some of the lowest yields.
The conditions also contributed to widespread fires during harvest, culminating in the devastating blaze at Highlands Farm in Essex on 24 July. The fire spread to a fertiliser store, causing a huge explosion and injuring 20 firefighters.
Extreme daytime heat forced many farmers across the South and East to harvest through the night, and by early August, average yields confirmed one of the worst UK grain harvests on record.
The Energy and Climate Intelligence Unit estimated that the heatwaves had wiped around 2.5 million tonnes from UK grain production, representing an estimated £305 million to £390 million in lost farmer revenue.
National averages hide the real story
National yield figures tell us that this was a poor harvest – but they don’t tell us everything.
Take spring barley. By August, yields in some areas were averaging just 4.1 t/ha – 29% below the five-year average. Better yields in northern regions pulled the UK average up to around 4.6 t/ha.
Although this is still 19% below average, that geographical variation is significant. Different crops, regions and farms were not affected in the same way. And that becomes even more obvious when we look at the range of yields being reported.
Last year, we highlighted the extreme yield variability between farms. In 2026, that has become even more pronounced – for every major crop, the gap between the highest and lowest yields recorded has widened.
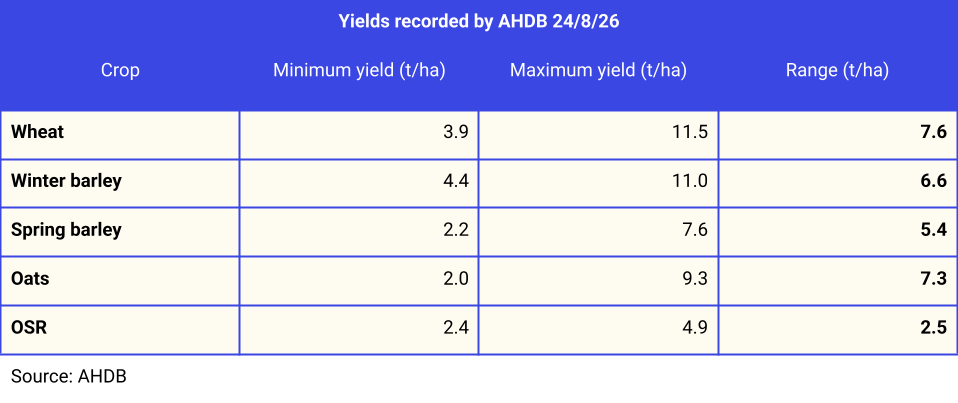
Yield variability has increased further in harvest 2026
For wheat alone, the range has expanded from 5.8 t/ha last year to 7.6 t/ha. The financial consequences of such variation are substantial from farm to farm.
Not every crop followed the same script
Oilseed rape has bucked the trend with an exceptionally strong year.
The planted area increased by around 32%, while yields reached their highest level on record. Put those two factors together and our projections suggest UK OSR production could be 42.7% higher than last year.
That is almost the mirror image of spring barley, where we project a fall of 27.5%, as lower yields combine with reduced planting.
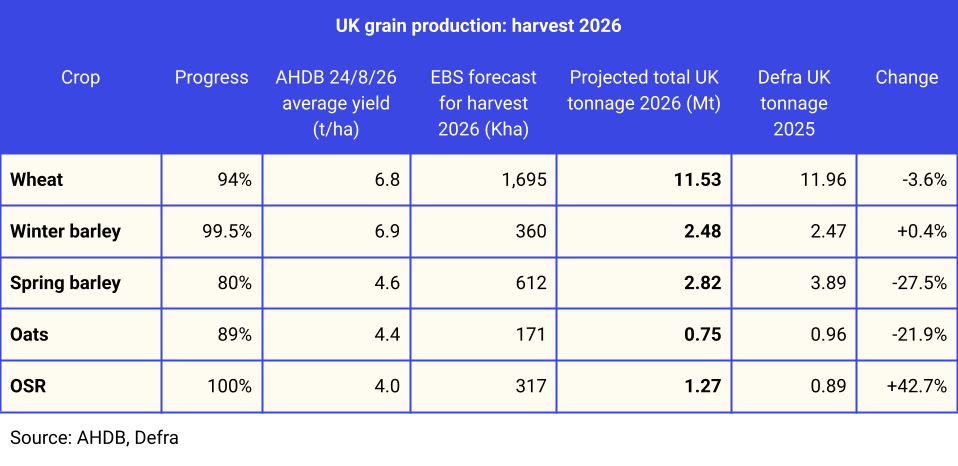
Projected production per crop for harvest 2026
Wheat sits somewhere between the two. Based on the latest yield averages and the 2025 planting intentions reported in the AHDB Early Bird Survey, we project UK wheat production at around 11.5 million tonnes, down approximately 3.6% on last year.
These are projections rather than final production figures, but they give us a useful way of thinking about the scale of the harvest.
Zoom in on the farmgate
Harvest 2026 isn’t really one harvest. It’s a collection of very different crop, regional and farm-level stories.
A farmer with this year’s lowest recorded wheat yield is producing 390 tonnes from 100 hectares. A farmer with the highest yield is producing 1,150 tonnes from the same planted area.
That’s a difference of 760 tonnes. Taking our latest ex-farm spot price for feed wheat in the East Midlands, that works out as a gap in revenue between these two farmers of £209.90 x 760 = £159,524.
That’s before we consider the costs of growing, drying, storing and marketing the crop. This is why it’s so important to be clear on your own costs and the price you need to hit to make a profit.
A national average can tell us whether the UK has had a good or bad harvest. A farm’s own figures tell you something much more useful: what your crop is actually worth to your business.
Impact on the grain market
The UK is potentially heading into a year with significantly less wheat and barley available domestically, while OSR supply will be substantially higher.
For farmers with wheat or barley to sell, tighter domestic supply will provide some support to prices – although global production and imports will ultimately determine how much of that tightness feeds through to the farmgate.
OSR presents a different challenge. A 42.7% increase in projected domestic production means considerably more OSR looking for a home, potentially creating downward pressure on the market unless demand keeps pace.
Pressure on margins
Harvest 2026 comes after an extremely difficult run for UK arable farmers.
Following three consecutive challenging seasons, cumulative revenue losses across UK arable farming are estimated at nearly £4.8 billion over 2024–2026.
That changes the context in which farmers are making marketing decisions. With continued pressure on margins, farm-level data becomes more important than ever:
What was your actual yield by field?
How did it compare with previous years?
Which varieties and fields performed best?
In a year when wheat yields can differ by 7.6 t/ha between farms, using a national average to make marketing decisions could lead you badly astray.
The same applies to storage. A tonne left in the shed isn’t automatically becoming more valuable. Its value depends on the price you can achieve later, less the cost and risk of holding it.
Knowing your own numbers lets you work out whether waiting for a better price is actually adding value – or simply delaying a sale.
Know your numbers
The national harvest story helps us understand supply, demand and where the market might go next – but your own numbers matter more.
With yields varying so dramatically, the economics of selling, storing or forward-selling grain will be different for every business.
The farmers best placed to make those decisions aren’t necessarily the ones who can predict where the market will be in six months.
They’re the ones who know what their grain is worth today, what it costs to hold and what price they need to achieve from the tonnes still in store.
Test the market today. Post a free crop listing – for spot or future movement – and find out what buyers are currently willing to pay.
This article is for general information only and does not constitute advice. While we make every effort to ensure the accuracy of the content at the time of publication, Hectare Trading makes no guarantee regarding the data provided.